
Narrative TAM vs. actual spend: how we size hard-tech markets honestly
Key takeaways
- Narrative size is the big industry number in a report; actual spend is the revenue that can realistically flow to your business model at your price.
- Hard-tech founders should size markets from the unit up, asking what budget line they replace, who signs, how often they buy and at what margin.
- Whether a market is expanding or static changes how strong your value proposition must be.
- A credible path to positive cash flow, built on unit economics, persuades investors more than any headline TAM.
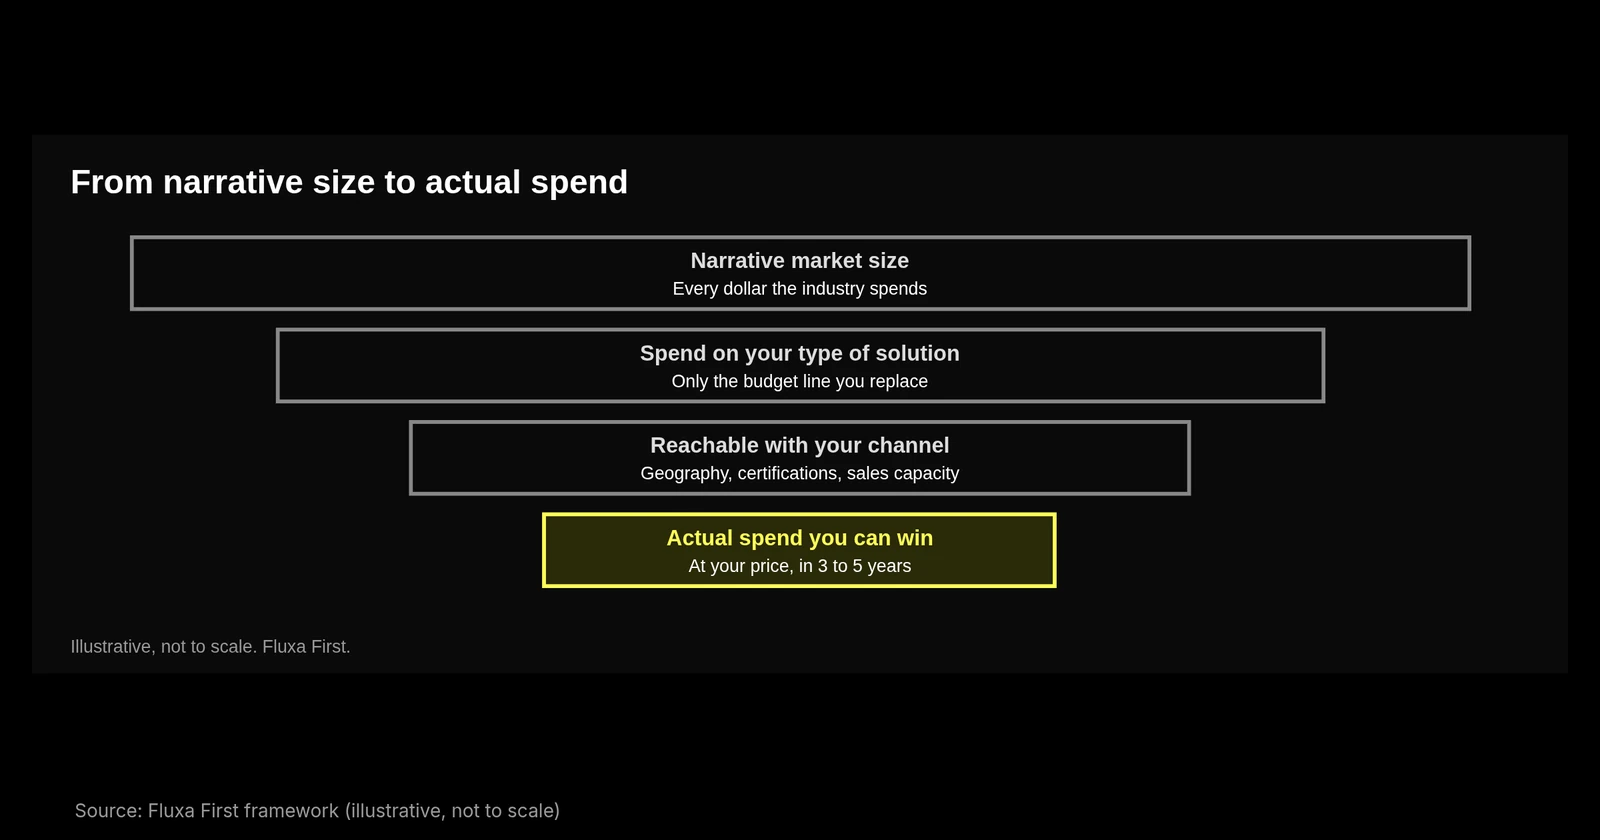
Every pitch deck has a slide with a very large number on it. The industry spends billions every year, so even a small slice will make a great company. We understand the appeal. But in our studio we push founders to separate two things that often get blended together: the narrative size of a market and the actual spend their business can win. Investors fund the second.
What is narrative size?
Narrative size is the impressive top-down number: total spending in an industry, pulled from a report or a conference talk. It is directionally useful. It tells you the outer boundary of an opportunity and whether a market is big enough to matter. It is also easy to misuse, because almost none of that spending is available to a new company.
Take a hypothetical startup building autonomous inspection for industrial pipelines. The narrative number might be total global spending on pipeline maintenance. But most of that pays for excavation, steel, welding crews and compliance paperwork. The startup’s product replaces one part of one budget line: the cost of inspection, for certain pipe types, in regions where its certification is accepted.
What is actual spend?
Actual spend is the revenue that could realistically flow to your specific business model. It depends on four things:
- The budget line you replace. Which existing spending does your customer stop, or shift to you?
- Your price and pricing model. Unit sale, subscription, per-inspection fee or service contract.
- Your ability to reach and convert buyers. Channels, certifications, sales cycle length and capacity.
- The share you can credibly win in the next three to five years.
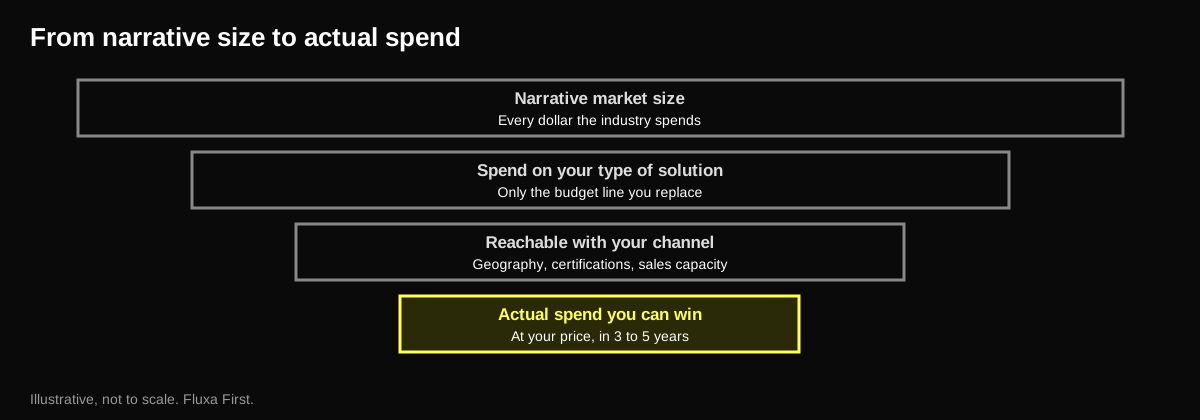
The standard TAM, SAM and SOM framework helps here when it is used honestly. TAM is the theoretical ceiling. SAM is the portion you can serve given your product, geography and channel. SOM, which we also call the entry wedge, is what you can actually capture soon. The mistake is treating TAM as the plan.
Why does this matter more in hard tech?
Hardware and industrial markets punish overconfidence. Sales cycles are long, buyers are concentrated, qualification takes time and each unit costs real money to build. A software company that overestimates its market loses some marketing spend. A hardware company that overestimates its market builds a factory for demand that does not arrive.
Two questions we ask early:
Is the market expanding or static? An expanding market, driven by new technology, regulation, infrastructure or customer behavior, creates new demand that a startup can capture without taking share from incumbents. A static market forces you to take share, which demands a much stronger value proposition: dramatically better, much cheaper or fundamentally different. A large static market can be harder to enter than a smaller one that is growing fast.
How much of the spend fits our price point? Even in a huge industry, only a slice of buyers will pay your price for your form factor through your channel.
How do unit economics anchor market size?
The most persuasive market slide is often not a market slide at all. It is a unit economics slide. If you know what one unit sells for, what it costs to make, what it costs to sell and how many units a reachable customer buys, you can build revenue up from the bottom and check it against the narrative number from the top.
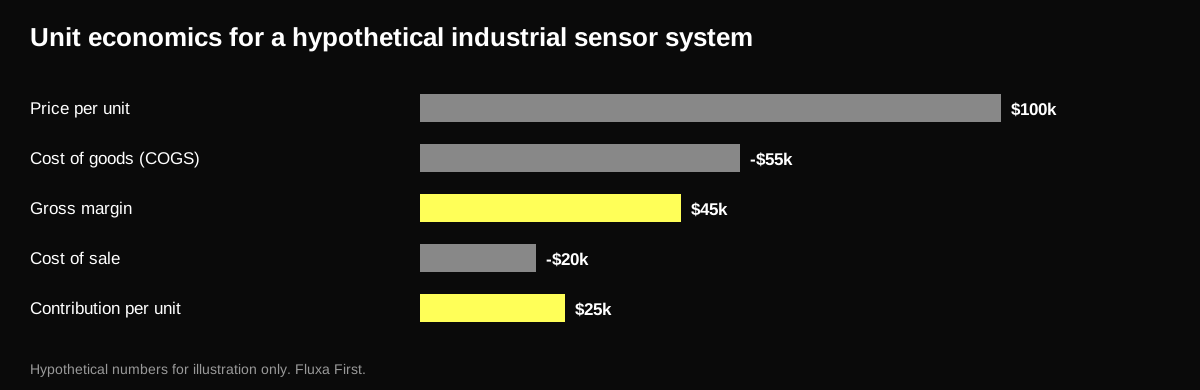
A quick test we use when comparing solution spaces: if you won a small share of the reachable market each year, say one percent, would the resulting gross margin add up to a business worth building? If the answer only works under heroic assumptions, the solution space probably needs to change, not the spreadsheet.
| Question | Narrative approach | Actual spend approach |
|---|---|---|
| How big is it? | Total industry spending | Budget line you replace, at your price |
| Who pays? | The industry | A named buyer persona with a budget |
| How fast? | A share of a growing pie | Sales cycle, capacity and qualification time |
| Is it worth it? | The number is huge | Margins at realistic share fund the company |
How we use this in the studio
We think market sizing should be a decision tool, not a fundraising decoration. That means sizing each candidate solution space from the unit up, comparing gross margins and cost of sale across them, and dropping the ones whose economics only work in the narrative. That usually means saying no to most of the theoretical market, which is fine. A focused wedge with strong unit economics is how a company earns the right to expand.
It also connects directly to how we finance companies. When the plan is built on actual spend, capital can be matched to milestones, as we described in matching the money to the milestones, and use studio-aligned capital that grows with revenue rather than betting on a headline. And it starts with the problem, not the market report: pricing power comes from pain and urgency, which we covered in our post on the critical pressure horizon.
Investors have seen thousands of billion-dollar TAM slides. The founders who stand out are the ones who can show, honestly, how the first dollars arrive and why the next ones will follow.
More founder playbooks are collected under topics.
Frequently asked questions
What is the difference between TAM and actual spend?
TAM is the theoretical maximum demand if you won every customer with no competition. Actual spend is the portion of real budgets that could flow to your specific product, at your price, through your sales channel, in the next few years. Investors care that you understand TAM, but they fund the plan built on actual spend.
How should a hardware startup calculate its market size?
Start bottom up. Count the customers you can actually reach, the units or contracts each would buy, the price and the replacement cycle. Then check it against the specific budget line you replace. Use top-down industry figures only as an outer boundary and a sanity check, never as the core of the plan.